The Ultimate Guide for Using SmartArt in Presentations
SmartArt is a powerful tool that can transform dull and monotonous presentations into visually captivating experiences. As we all know, visual aids are crucial in engaging an audience and conveying information effectively.
That’s where PowerPoint SmartArt comes in. With its wide range of diagrams, flowcharts, and organizational charts, SmartArt diagram enables presenters to present complex concepts and data clearly and compellingly.
In this comprehensive guide, we will explore the various features and functionalities of SmartArt in business presentations and how you can leverage its full potential to create impactful presentations.
Get ready to elevate your presentation game with the ultimate guide for using SmartArt diagrams!
What is SmartArt in PowerPoint?
SmartArt is an inbuilt tool in PowerPoint that allows presenters to convert their text into graphics instantly. SmartArt facilitates the swift creation of visually appealing presentations by offering a predefined selection of SmartArt graphics, such as lists, processes, relationships, matrices, and pictures. Moreover, SmartArt graphic PowerPoint automatically extracts colors from your theme, ensuring a cohesive and unified look throughout your presentation.
With prebuilt SmartArt PowerPoint templates, you can incorporate prebuilt animations and customize fonts, themes, and colors. This allows for the swift creation of visually captivating presentations, simplifying the process while maintaining visual appeal.
Types of SmartArt Graphics in PowerPoint
SmartArt graphics are a versatile feature in PowerPoint that allows you to communicate ideas and data visually. There are many types of SmartArt graphics available, each with its own unique layout and purpose.
Let’s explore the different types of SmartArt graphics in PowerPoint.
Process Graphics
Process graphics are ideal when presenting a process’s series of steps or actions. They can be used to show how a product is made, how a service is delivered, or how a project is completed.
Relationship Graphics
Relationship graphics is a useful tool for illustrating the connections and interdependencies among various elements. They are commonly used in organizational charts and can be used to show hierarchies, dependencies, and connections between different entities.
Hierarchy Graphics
Hierarchy graphics are used to present information in a tree-like structure. They are ideal for presenting organizational charts, family trees, and other types of hierarchical structures.
Matrix Graphics
Matrix graphics are employed to illustrate the interplay and relationships among various elements. They are commonly used in SWOT analysis, product comparison tables, and other types of comparative analyses.
Pyramid Graphics
Pyramid graphics are used to show hierarchical relationships between different elements. They are commonly used in Maslow’s hierarchy of needs, food pyramids, and other types of hierarchical structures.
List Graphics
List graphics are used to present information linearly. They are commonly used in bullet points, to-do lists, and other types of sequential presentations.
Cycle Graphics
Cycle graphics are used to show how different elements repeat or cycle through a process. They are commonly used in project management, marketing, and other types of cyclical processes.
How to Make a PPT Presentation with SmartArt (Step by Step)
If you’re new to SmartArt, here’s a quick step-by-step guide on how to add SmartArt to your slides:
- Open PowerPoint and open your presentation.
- Navigate to the slide where you want to add SmartArt or insert a new slide by clicking the ‘New Slide’ button on the ‘Home’ tab.
- Go to the ‘Insert’ tab.
- In the ‘Illustrations’ group, click the ‘SmartArt’ option. A SmartArt graphic gallery will appear.

- Here you select any SmartArt graphic by clicking on it. The gallery contains categories such as List, Process, Cycle, Hierarchy, Relationship, Matrix, and more.

- Once you select a SmartArt graphic, click on ‘Ok.’
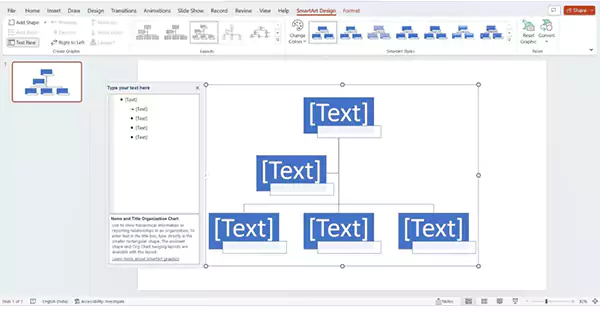
- Once you select a SmartArt graphic, a dialogue box will appear, allowing you to input your content. Within this dialogue box, you can include text, make layout adjustments, and personalize the appearance of the SmartArt graphic.

- Input your content into the text pane on the SmartArt graphic’s left side. You can add or delete text by using the buttons above the text pane.
- You can modify the look of your SmartArt graphic using the available options in the ribbon. Try out different settings to discover the visual style that complements your presentation.

- To save your work, click on the ‘File’ tab and choose ‘Save’ or ‘Save As.’
Well done! You have now accomplished the creation of a PowerPoint presentation featuring SmartArt.
Remember to practice and explore different SmartArt graphics and options to create visually appealing and engaging presentations.
If you’re looking for more resources, you can find a wide selection of free PPT templates online that can enhance your presentation and save you time and effort in designing from scratch.
Tips and Tricks for Using SmartArt in Presentations
Keeping It Simple
When it comes to using SmartArt in presentations, less is often more. Refrain from overloading your slides with graphics, and avoid using too many different types of SmartArt on one slide.
Using SmartArt to Enhance Your Message
SmartArt in business presentations should focus on amplifying your message rather than diverting attention from it. Use a SmartArt graphic that supports your content and helps to clarify your message. Avoid using PowerPoint SmartArt for purely decorative purposes.
Incorporating Animations and Transitions
Incorporating animations and transitions into your SmartArt graphic can enhance its visual appeal and captivate your audience’s attention. Use them sparingly, however, and make sure they don’t detract from your message.
Using SmartArt with Other Visual Aids
To enhance the engagement and information value of your presentations, SmartArt can be effectively combined with other visual aids like charts, graphs, and images. You can discover the most effective arrangement that best suits your content by exploring various combinations.
Common Mistakes to Avoid When Using SmartArt
Overloading Your Slide with Graphics
Presenters often commit a common error while utilizing SmartArt: cramming their slides with excessive graphics. This overwhelming approach can distract the audience and divert their attention from the intended message.
Choosing the Wrong Type of SmartArt
Selecting an inappropriate SmartArt in business presentation content is another frequently-made mistake. Make sure you choose a layout that supports your message and presents your information clearly and concisely.
Neglecting to Edit Text and Images
Editing your text and images is essential to creating professional-looking presentation SmartArt graphics. Make sure you take the time to edit and customize your text and images to look polished and professional.
Not Testing Your Presentation on Different Devices
Finally, it’s essential to test your presentation on different devices, as SmartArt in business presentations may appear differently depending on the device being used. Ensure your graphics look great on all devices to ensure a seamless presentation experience for your audience.
Wrapping It Up
Presentation SmartArt graphics is a game-changer when it comes to creating impactful presentations. By leveraging its diverse range of graphics, customizable layouts, and intuitive features, you can transform your content into visually appealing and easily understandable visual aids.
Remember to choose the right SmartArt graphic PowerPoint that best suits your message and effectively conveys your information. Experiment with different colors, styles, and layouts to create a visually consistent and engaging presentation. However, balancing aesthetics and functionality is crucial, ensuring that your SmartArt graphic enhances rather than distracts from your content.
Elevate your communication skills and leave a lasting impression by mastering the art of SmartArt diagrams in your presentations.
Follow Us
Latest Post


